AI in retail is full of promise, but senior leaders ultimately care about one thing: results. It is not enough to experiment with new technology or deploy pilots that look innovative on paper. Executives must justify investments with measurable returns that impact revenue, margins, or customer satisfaction. This is where AI readiness comes in.
Why ROI Is the Executive’s North Star
Investing in enriched, structured product data might feel like back-end work, but it is the foundation that determines whether AI initiatives succeed or fail. By tying readiness directly to outcomes such as conversion rates, return reduction, and time-to-market speed, executives can calculate ROI with clarity and confidence.
Framing AI Readiness as a Revenue Driver
Too often, AI readiness is framed as an operational cost rather than a strategic driver. This is a mistake. Every improvement in product data quality flows downstream into customer-facing metrics that matter. Clean, enriched catalogs improve search visibility, PDP performance, and shopper trust. These improvements are concrete revenue multipliers.
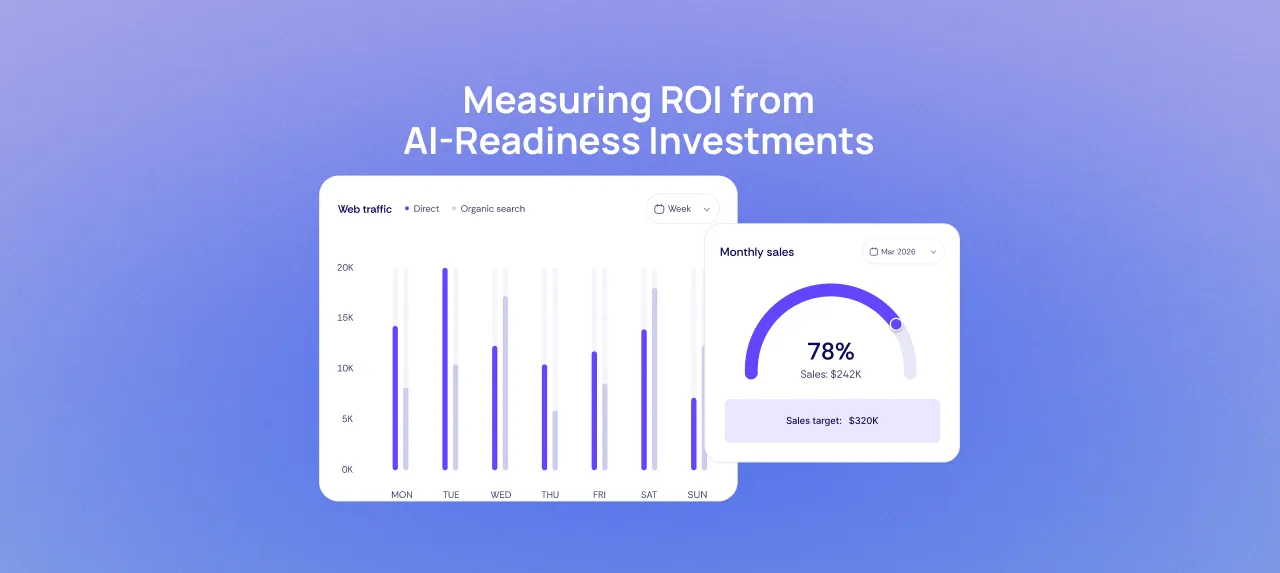
.webp)
For example, a more complete attribute set allows natural language queries like “waterproof boots under $150” to surface relevant products, increasing discoverability and add-to-cart rates. Executives who reframe readiness as revenue enablement secure stronger buy-in from boards and investors.
Conversion Rate Impact
Conversion rate is one of the most direct and measurable outcomes of AI readiness. Industry benchmarks show that optimized PDPs with complete attributes and high-quality imagery can drive 20 to 40 percent improvements in conversion.
Every missing attribute is a missed opportunity to match intent. Every vague description or poor image creates hesitation. Enrichment fills those gaps, giving AI tools the data they need to surface the right product to the right customer. For executives, conversion gains provide a clear ROI narrative: enrichment translates directly into sales.
Reduced Return Rates
Returns are a silent profit killer. Industry averages hover around 20 to 30 percent in e-commerce, and poor product data is one of the top drivers. When sizing, color, or compatibility attributes are inaccurate or missing, shoppers buy the wrong items and send them back.
AI readiness tackles this problem head-on. Enriched attributes ensure clarity, while high-quality images align shopper expectations with reality. The result is fewer mismatches and lower returns. Executives should track return rates before and after enrichment to capture another quantifiable dimension of ROI.
Faster Time-to-Market
Time-to-market is often overlooked when calculating ROI, yet it has massive implications for revenue. Seasonal products that miss their launch window cannot recapture lost sales. New SKUs that stall in backlog delay marketing campaigns and marketplace expansion.
By automating enrichment and embedding governance, retailers dramatically reduce backlog times. Faster product launches mean capturing revenue earlier, testing campaigns more effectively, and gaining competitive advantage in fast-moving categories. For executives, this speed translates into higher revenue velocity and stronger market positioning.
Case Metrics: Before vs After AI Readiness
Executives respond best to comparative metrics. By setting up control groups, such as PDPs optimized with enrichment versus those left unchanged, retailers can quantify ROI across multiple dimensions.
Sample metrics include:
- Conversion lift: percent improvement on enriched PDPs.
- Return reduction: percent decrease when attributes and images are accurate.
- Time-to-market: backlog clearance improving launch speed by percent.
- Visibility: improved search ranking and marketplace acceptance rates.
These before-and-after comparisons tell a story that boards understand. AI readiness investments are not speculative, they are measurable improvements with financial impact.
Building the ROI Story for Boards and Investors
Boards and investors demand clarity, not jargon. When presenting AI readiness initiatives, executives should translate technical improvements into business language. Rather than talking about schema markup or taxonomy alignment, frame results in terms of conversion, returns, and revenue velocity.
A clear ROI story includes:
- The baseline problem (backlogs, poor PDP performance, high return rates).
- The intervention (data enrichment, schema compliance, governance).
- The measurable outcome (conversion lift, fewer returns, faster launches).
By positioning AI readiness as a proven driver of margin improvement and growth, executives gain the support they need to expand investment and scale AI initiatives further.
ROI Is the Language of Leadership
AI readiness is not an abstract concept. It is the foundation that determines whether investments in AI succeed or fail. By tying readiness directly to metrics like conversion, returns, and time-to-market, retail leaders can build a compelling ROI case that resonates in the boardroom.
Executives who measure and communicate these outcomes elevate AI readiness from an operational necessity to a strategic growth driver. For those seeking to scale AI across the enterprise, proving ROI is the key to unlocking further investment and long-term competitive advantage.
Download the AI Readiness ROI Framework to map metrics directly to your business objectives.